Example usage
This is an example tutorial of how to tdads can be used to analyze persistence diagrams. First, let’s make sure we have all the necessary dependencies:
%pip install ripser
%pip install matplotlib
Requirement already satisfied: ripser in /home/docs/checkouts/readthedocs.org/user_builds/tdads/envs/latest/lib/python3.10/site-packages (0.6.10)
Requirement already satisfied: Cython in /home/docs/checkouts/readthedocs.org/user_builds/tdads/envs/latest/lib/python3.10/site-packages (from ripser) (3.0.10)
Requirement already satisfied: numpy in /home/docs/checkouts/readthedocs.org/user_builds/tdads/envs/latest/lib/python3.10/site-packages (from ripser) (1.26.4)
Requirement already satisfied: persim in /home/docs/checkouts/readthedocs.org/user_builds/tdads/envs/latest/lib/python3.10/site-packages (from ripser) (0.3.7)
Requirement already satisfied: scipy in /home/docs/checkouts/readthedocs.org/user_builds/tdads/envs/latest/lib/python3.10/site-packages (from ripser) (1.14.0)
Requirement already satisfied: scikit-learn in /home/docs/checkouts/readthedocs.org/user_builds/tdads/envs/latest/lib/python3.10/site-packages (from ripser) (1.5.1)
Requirement already satisfied: deprecated in /home/docs/checkouts/readthedocs.org/user_builds/tdads/envs/latest/lib/python3.10/site-packages (from persim->ripser) (1.2.14)
Requirement already satisfied: hopcroftkarp in /home/docs/checkouts/readthedocs.org/user_builds/tdads/envs/latest/lib/python3.10/site-packages (from persim->ripser) (1.2.5)
Requirement already satisfied: joblib in /home/docs/checkouts/readthedocs.org/user_builds/tdads/envs/latest/lib/python3.10/site-packages (from persim->ripser) (1.4.2)
Requirement already satisfied: matplotlib in /home/docs/checkouts/readthedocs.org/user_builds/tdads/envs/latest/lib/python3.10/site-packages (from persim->ripser) (3.9.1)
Requirement already satisfied: threadpoolctl>=3.1.0 in /home/docs/checkouts/readthedocs.org/user_builds/tdads/envs/latest/lib/python3.10/site-packages (from scikit-learn->ripser) (3.5.0)
Requirement already satisfied: wrapt<2,>=1.10 in /home/docs/checkouts/readthedocs.org/user_builds/tdads/envs/latest/lib/python3.10/site-packages (from deprecated->persim->ripser) (1.16.0)
Requirement already satisfied: contourpy>=1.0.1 in /home/docs/checkouts/readthedocs.org/user_builds/tdads/envs/latest/lib/python3.10/site-packages (from matplotlib->persim->ripser) (1.2.1)
Requirement already satisfied: cycler>=0.10 in /home/docs/checkouts/readthedocs.org/user_builds/tdads/envs/latest/lib/python3.10/site-packages (from matplotlib->persim->ripser) (0.12.1)
Requirement already satisfied: fonttools>=4.22.0 in /home/docs/checkouts/readthedocs.org/user_builds/tdads/envs/latest/lib/python3.10/site-packages (from matplotlib->persim->ripser) (4.53.1)
Requirement already satisfied: kiwisolver>=1.3.1 in /home/docs/checkouts/readthedocs.org/user_builds/tdads/envs/latest/lib/python3.10/site-packages (from matplotlib->persim->ripser) (1.4.5)
Requirement already satisfied: packaging>=20.0 in /home/docs/checkouts/readthedocs.org/user_builds/tdads/envs/latest/lib/python3.10/site-packages (from matplotlib->persim->ripser) (24.1)
Requirement already satisfied: pillow>=8 in /home/docs/checkouts/readthedocs.org/user_builds/tdads/envs/latest/lib/python3.10/site-packages (from matplotlib->persim->ripser) (10.4.0)
Requirement already satisfied: pyparsing>=2.3.1 in /home/docs/checkouts/readthedocs.org/user_builds/tdads/envs/latest/lib/python3.10/site-packages (from matplotlib->persim->ripser) (3.1.2)
Requirement already satisfied: python-dateutil>=2.7 in /home/docs/checkouts/readthedocs.org/user_builds/tdads/envs/latest/lib/python3.10/site-packages (from matplotlib->persim->ripser) (2.9.0.post0)
Requirement already satisfied: six>=1.5 in /home/docs/checkouts/readthedocs.org/user_builds/tdads/envs/latest/lib/python3.10/site-packages (from python-dateutil>=2.7->matplotlib->persim->ripser) (1.16.0)
Note: you may need to restart the kernel to use updated packages.
Requirement already satisfied: matplotlib in /home/docs/checkouts/readthedocs.org/user_builds/tdads/envs/latest/lib/python3.10/site-packages (3.9.1)
Requirement already satisfied: contourpy>=1.0.1 in /home/docs/checkouts/readthedocs.org/user_builds/tdads/envs/latest/lib/python3.10/site-packages (from matplotlib) (1.2.1)
Requirement already satisfied: cycler>=0.10 in /home/docs/checkouts/readthedocs.org/user_builds/tdads/envs/latest/lib/python3.10/site-packages (from matplotlib) (0.12.1)
Requirement already satisfied: fonttools>=4.22.0 in /home/docs/checkouts/readthedocs.org/user_builds/tdads/envs/latest/lib/python3.10/site-packages (from matplotlib) (4.53.1)
Requirement already satisfied: kiwisolver>=1.3.1 in /home/docs/checkouts/readthedocs.org/user_builds/tdads/envs/latest/lib/python3.10/site-packages (from matplotlib) (1.4.5)
Requirement already satisfied: numpy>=1.23 in /home/docs/checkouts/readthedocs.org/user_builds/tdads/envs/latest/lib/python3.10/site-packages (from matplotlib) (1.26.4)
Requirement already satisfied: packaging>=20.0 in /home/docs/checkouts/readthedocs.org/user_builds/tdads/envs/latest/lib/python3.10/site-packages (from matplotlib) (24.1)
Requirement already satisfied: pillow>=8 in /home/docs/checkouts/readthedocs.org/user_builds/tdads/envs/latest/lib/python3.10/site-packages (from matplotlib) (10.4.0)
Requirement already satisfied: pyparsing>=2.3.1 in /home/docs/checkouts/readthedocs.org/user_builds/tdads/envs/latest/lib/python3.10/site-packages (from matplotlib) (3.1.2)
Requirement already satisfied: python-dateutil>=2.7 in /home/docs/checkouts/readthedocs.org/user_builds/tdads/envs/latest/lib/python3.10/site-packages (from matplotlib) (2.9.0.post0)
Requirement already satisfied: six>=1.5 in /home/docs/checkouts/readthedocs.org/user_builds/tdads/envs/latest/lib/python3.10/site-packages (from python-dateutil>=2.7->matplotlib) (1.16.0)
Note: you may need to restart the kernel to use updated packages.
Now we’ll import all the packages we’ll need:
from tdads.machine_learning import *
from tdads.inference import *
from numpy.random import uniform
from numpy import array
from math import cos, sin, pi
from ripser import ripser
import matplotlib.pyplot as plt
For this tutorial we’ll create helper functions for generating data and persistence diagrams from circle and spheres:
# function to create a circle dataset and
# compute its diagram
def circle_diagram():
    # sample 100 points from the unit circle
    theta = uniform(low = 0, high = 2*pi, size = 100)
    data = array([[cos(theta[i]), sin(theta[i])] for i in range(100)])
    # compute persistence diagram
    diag = ripser(data, maxdim = 2)
    return [data, diag]

# function to create a sphere dataset and
# compute its diagram
def sphere_diagram():
    # sample 100 points from the unit sphere
    phi = uniform(low = 0, high = 2*pi, size = 100)
    theta = uniform(low = 0, high = pi, size = 100)
    data = array([[sin(theta[i])*cos(phi[i]), sin(theta[i])*sin(phi[i]), cos(theta[i])] for i in range(100)])
    # compute persistence diagram
    diag = ripser(data, maxdim = 2)
    return [data, diag]
Our dataset will be 5 circle datasets (and diagrams) and 5 sphere datasets (and diagrams), totalling 10:
result = [circle_diagram(), circle_diagram(), circle_diagram(), circle_diagram(), circle_diagram(),
          sphere_diagram(), sphere_diagram(), sphere_diagram(), sphere_diagram(), sphere_diagram()]
data = [r[0] for r in result]
diagrams = [r[1] for r in result]
Now we will use the bootstrap procedure to determine the significant topological features in each diagram:
def diag_fun(X, thresh):
    return ripser(X = X, thresh = thresh, maxdim = 2)
boot = diagram_bootstrap(diag_fun = diag_fun, dims = [0,1,2], alpha = 0.01)
boot_diagrams = [boot.compute(X = d, thresh = 2) for d in data]
The subsetted diagrams show that only the first five diagrams have one loop and only the last five diagrams have one void:
for i in range(10):
    print('Num clusters:' + str(len(boot_diagrams[i]['subsetted_diagram'][0])) + ', num loops: ' + str(len(boot_diagrams[i]['subsetted_diagram'][1])) + ', num voids: ' + str(len(boot_diagrams[i]['subsetted_diagram'][2])))
Num clusters:1, num loops: 1, num voids: 3
Num clusters:1, num loops: 1, num voids: 3
Num clusters:1, num loops: 1, num voids: 2
Num clusters:1, num loops: 1, num voids: 5
Num clusters:2, num loops: 1, num voids: 3
Num clusters:9, num loops: 3, num voids: 1
Num clusters:39, num loops: 2, num voids: 1
Num clusters:13, num loops: 3, num voids: 1
Num clusters:13, num loops: 2, num voids: 1
Num clusters:2, num loops: 4, num voids: 1
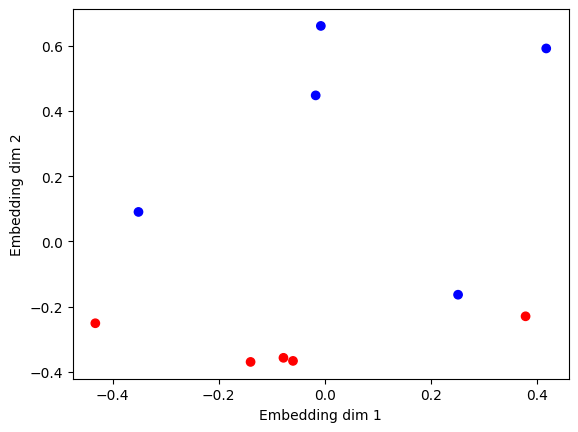
It seems like we have resolved the two groups of persistence diagrams, but a 2D MDS projection of the 10 diagrams visually confirms as much:
mds = diagram_mds(dim = 1) # for 1-dimensional homology
emb = mds.fit_transform(diagrams)
plt.scatter(emb[:,0], emb[:,1], color = ['red','red','red','red','red','blue','blue','blue','blue','blue'])
plt.xlabel('Embedding dim 1')
plt.ylabel('Embedding dim 2')
plt.show()
Finally we can use a permutation test of our two suspected groups to statistically capture their differences in dimensions 0, 1 and 2 (all are near/below 0.05):
pt = perm_test(p = float('inf'), iterations = 50, dims = [0,1,2])
res = pt.test([[d for d in diagrams[0:5]], [d for d in diagrams[5:10]]])
res['p_values']
{'0': 0.0196078431372549, '1': 0.0196078431372549, '2': 0.0196078431372549}